From Current Events to Lasting Questions: Survey Findings Report
A survey of 150 U.S. respondents finds that information-seeking triggered by news or public discussion frequently extends beyond immediate answers, with majorities returning to topics later and expecting lasting value from the material they find.

|
Posted: September 22, 2026 |
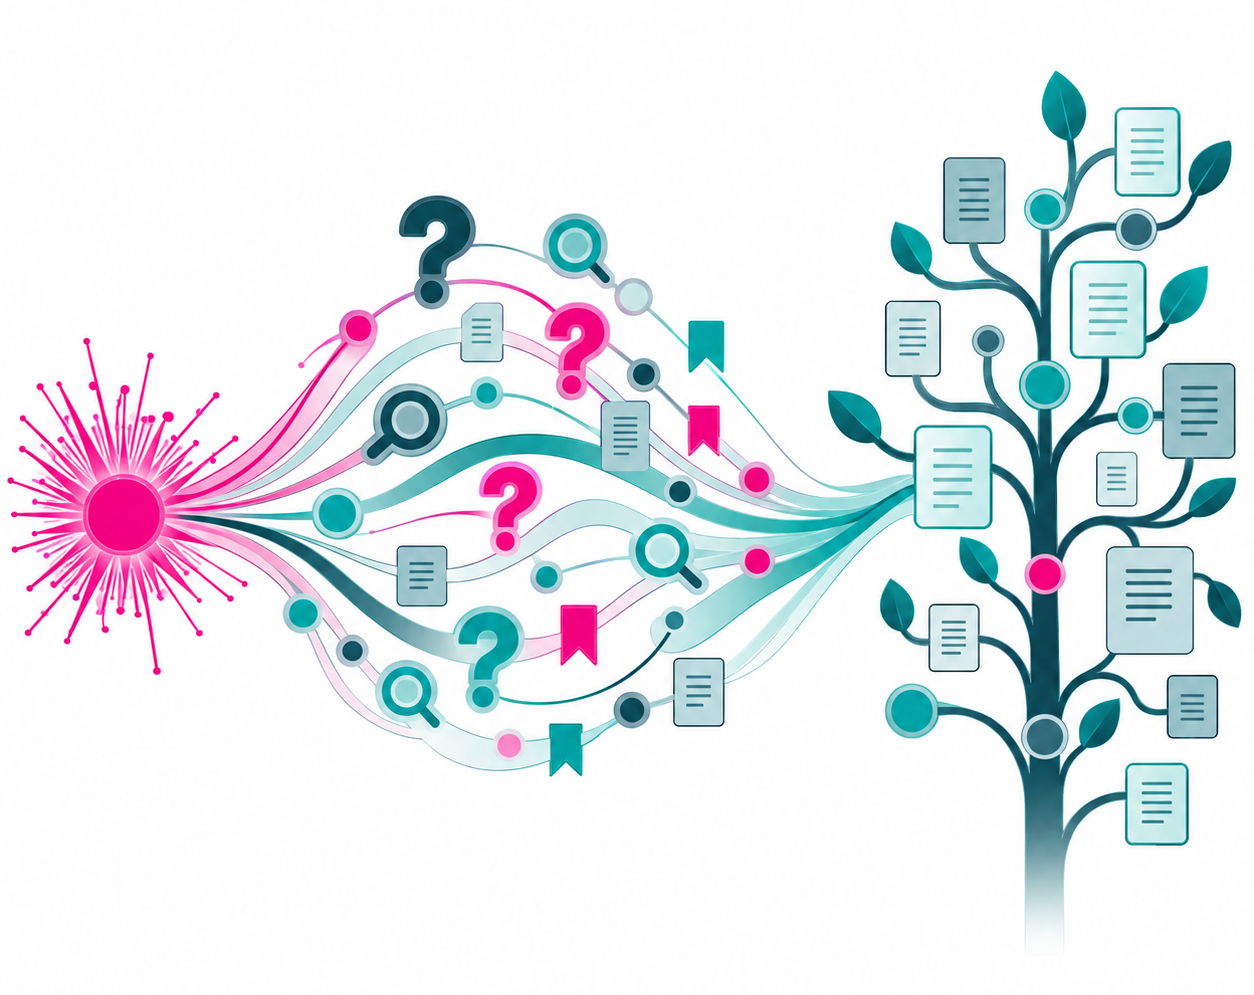
When a news story, announcement or public discussion prompts someone to seek additional information, the questions they want answered often reach beyond simply learning what happened. A survey conducted in September 2026 examined what people do after such moments, asking respondents to recall a recent occasion when something caught their attention and led them to look for more information. The 150 U.S. respondents, ranging in age from 18 to 64, described what they wanted to understand, what content helped, and whether they returned to the topic later.
The findings indicate that information needs triggered by current events are often multiple and include questions about personal relevance, required action, and context. The search for information also frequently continued beyond the initial occasion. Nearly half of respondents saved material for later, and three-quarters expected it to remain useful one month after they found it. A substantial minority also encountered company-produced content that addressed their questions, and among those who did, reported behaviours included saving, sharing, and acting on that material.
The survey was fielded on September 21, 2026, through Pollfish. Results are reported using stratified percentages based on respondent-level weights provided in the dataset. The workbook does not contain sufficient documentation to establish population-level representativeness or statistical significance, so differences between individual percentages should not be interpreted as statistically significant unless separately tested.
Key Findings
- 69.0% reported looking for information about the same underlying topic again after their initial search.
- 48.8% said they saved or bookmarked some of the information they found.
- 75.1% expected the information to remain at least somewhat useful one month later.
- 42.0% said they encountered content from a company, excluding news publishers, that addressed their question.
- Among the 66 respondents who reported encountering relevant company content, 96.8% described the contribution as very or somewhat helpful on a stratified basis.
These findings describe the experiences reported by the survey respondents. The available survey documentation does not establish that the sample is representative of the U.S. population, so the results should not be generalized to all U.S. adults.
The Triggering Topics Were Varied
Respondents were asked to classify the topic that most recently led them to seek more information. No single remembered topic accounted for more than one-fifth of the stratified sample.
Entertainment or sport was the most commonly identified substantive category at 18.9%. Money or the economy accounted for 13.4%, technology 12.9%, and health 12.4%. Laws or public policy was selected by 8.6%, local community issues by 6.8%, and product, service or company by 4.5%. Another 3.0% said the topic was something else, and 19.6% said they did not remember what the topic was mainly about.
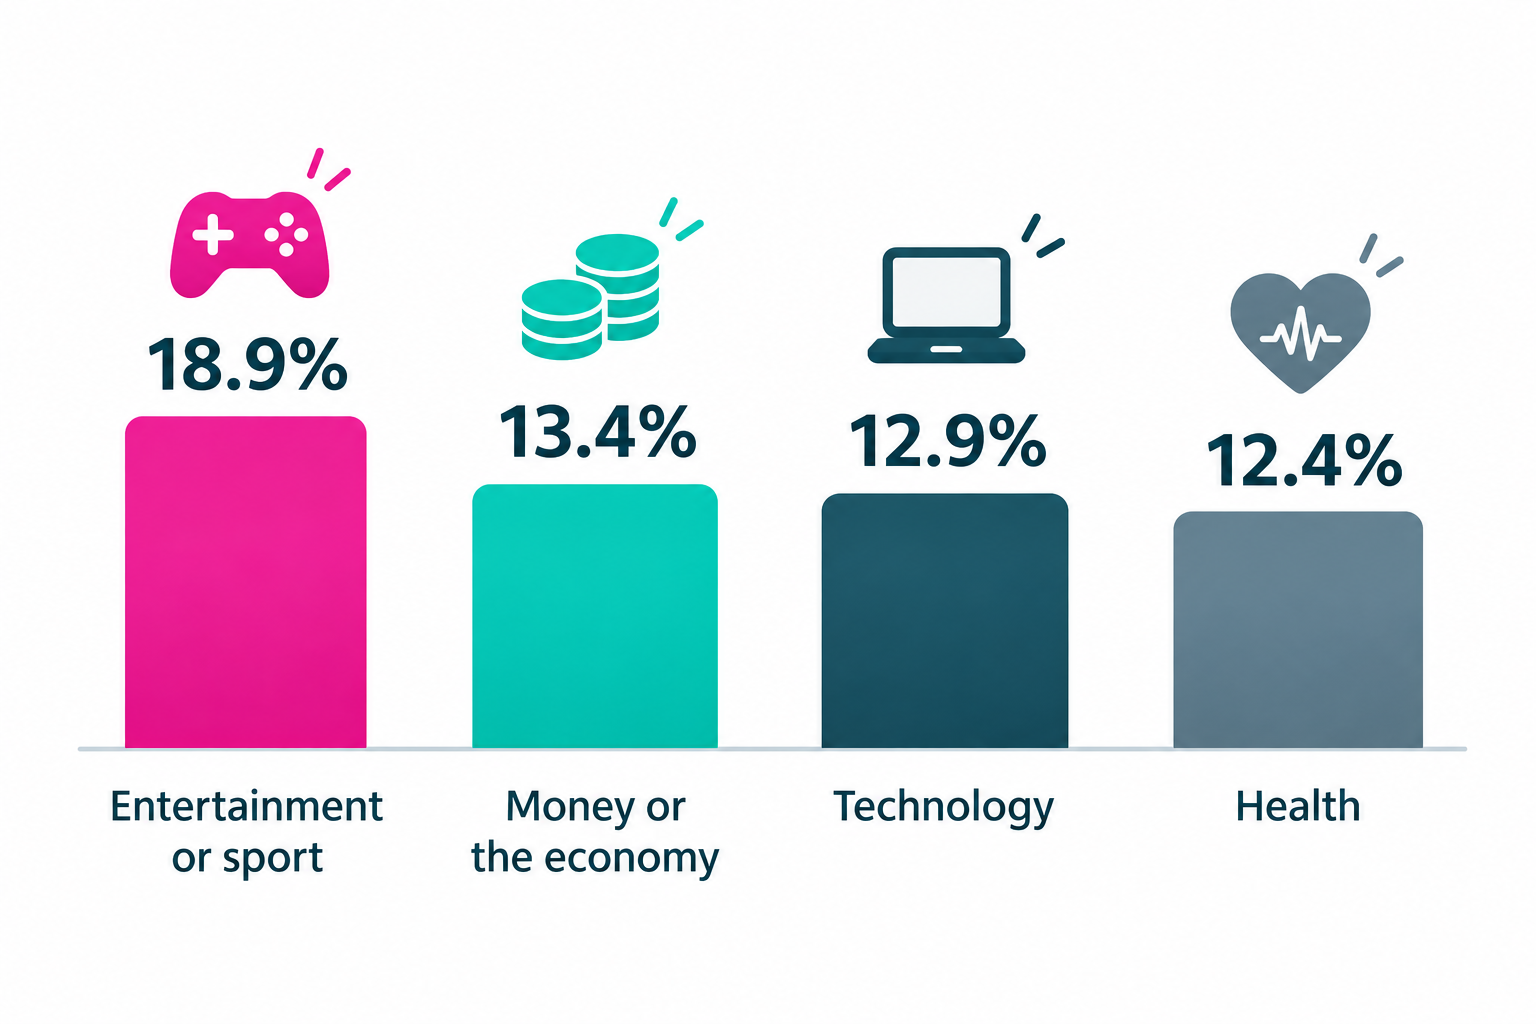
The spread across categories means the later findings are not associated with one single type of event or subject within the survey.
Respondents Were Often Trying to Answer Several Kinds of Questions
Respondents could select multiple things they had wanted to understand. The most common response on a stratified respondent basis was whether the development affected them, at 36.9%. This was closely followed by understanding what had happened, at 34.8%.
Other information needs extended beyond basic event details:
- 30.1% wanted to know what action, if any, they should take
- 28.7% wanted background to the topic
- 25.7% wanted to know why it had happened
- 20.3% wanted to know whether a claim was accurate
- 12.8% did not remember
- 0.8% selected something else
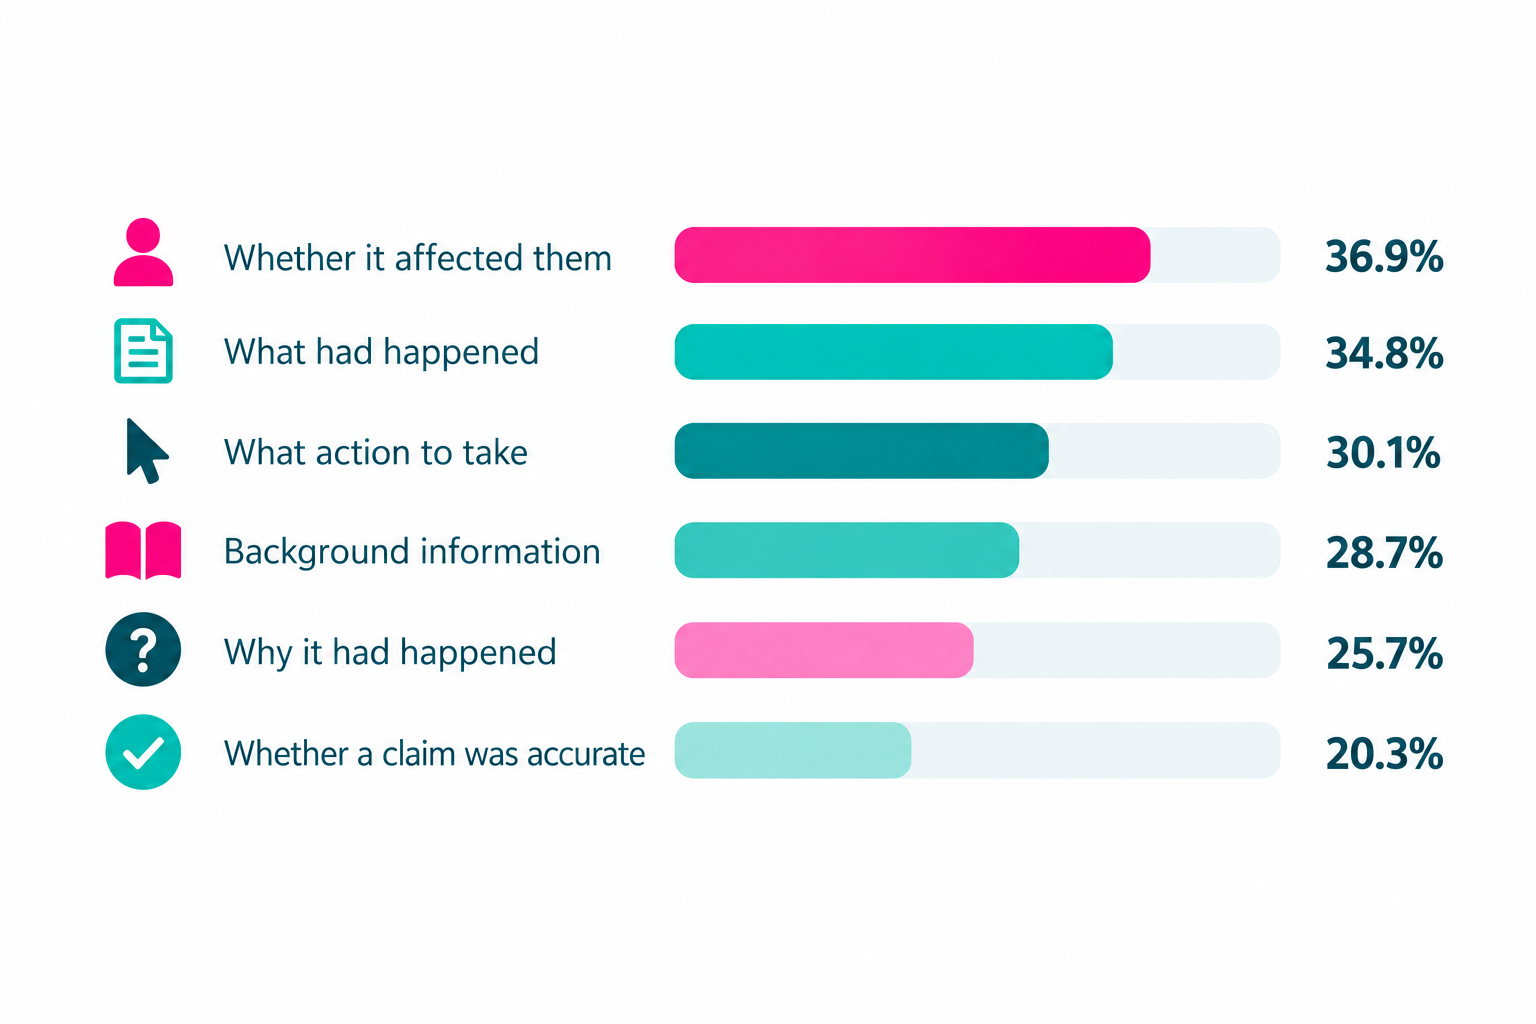
Because respondents could choose more than one option, these figures should not be added together.
The results show that a triggering event can generate informational needs involving personal relevance, action, background and verification alongside immediate factual understanding.
Detailed Explanations Were the Most Frequently Selected Helpful Format, but Preferences Were Distributed
Asked which type of content had helped them most, 25.3% selected a detailed explanation, the largest individual response. A brief news update was selected by 19.6%, while 17.3% selected a discussion among other people. Expert analysis or commentary was selected by 13.1%, a list of questions and answers by 7.7%, and a practical guide by 6.4%. Another 8.9% did not remember, 0.5% selected something else, and 1.3% said none of the content they found had helped.
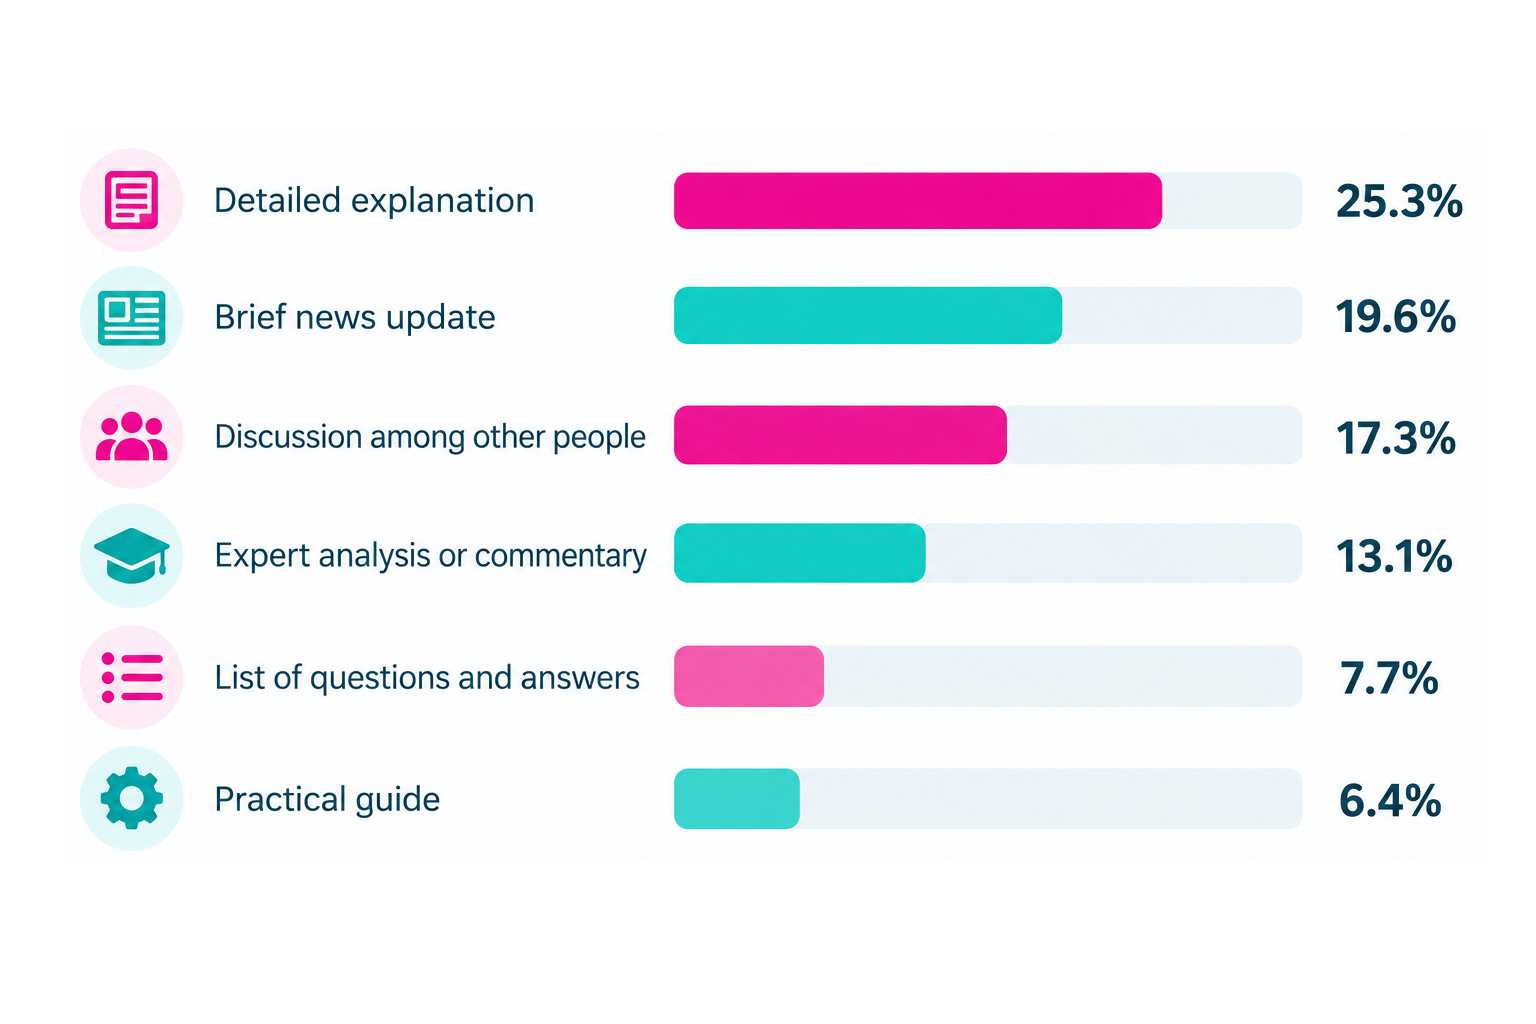
Only 1.3% said none of the content they found had helped.
The distribution is important: although detailed explanations were the largest category, roughly three-quarters of the stratified sample selected some other response. The finding therefore supports describing detailed explanations as the most frequently selected format rather than as the format preferred by most respondents.
Most Respondents Reported Returning to the Underlying Topic
A majority of respondents reported searching for information about the same underlying topic after the first occasion.
On a stratified basis:
- 28.9% looked again within the following week only
- 10.1% looked again more than a week later only
- 31.0% looked both within the following week and later
- 17.4% did not look again
- 4.7% said less than a week had passed and they had not yet looked again
- 7.8% did not remember
Combining the three affirmative categories, 69.0% reported returning to the topic at least once.
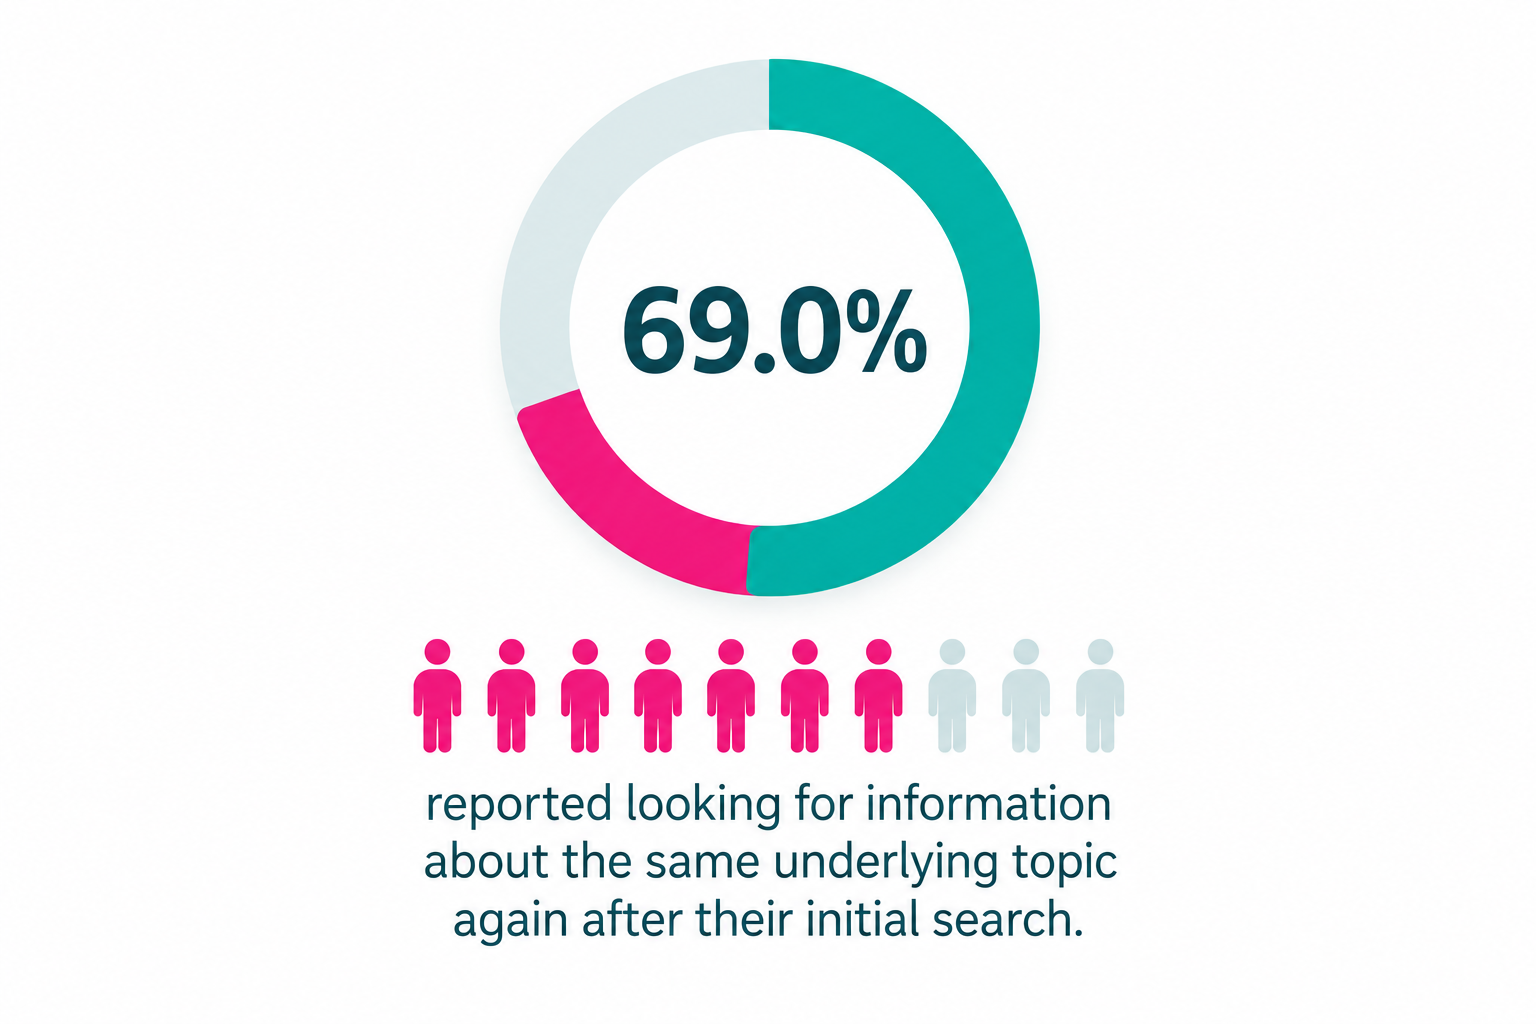
Two additional derived measures help describe the timing. 59.9% reported looking again within the following week, combining those who searched during the week only with those who searched during the week and later. 41.1% reported looking again more than a week later, combining those who searched later only with those who searched both during the first week and afterward. These categories overlap by design, so the 59.9% and 41.1% figures should not be added together.
The result provides evidence that the information need associated with the triggering event often persisted beyond the first search.
Nearly Half Saved Information for Future Use
Respondents were separately asked whether they had saved or bookmarked any of the information.
On a stratified basis, 48.8% said yes, 45.2% said no, and 6.0% did not remember.
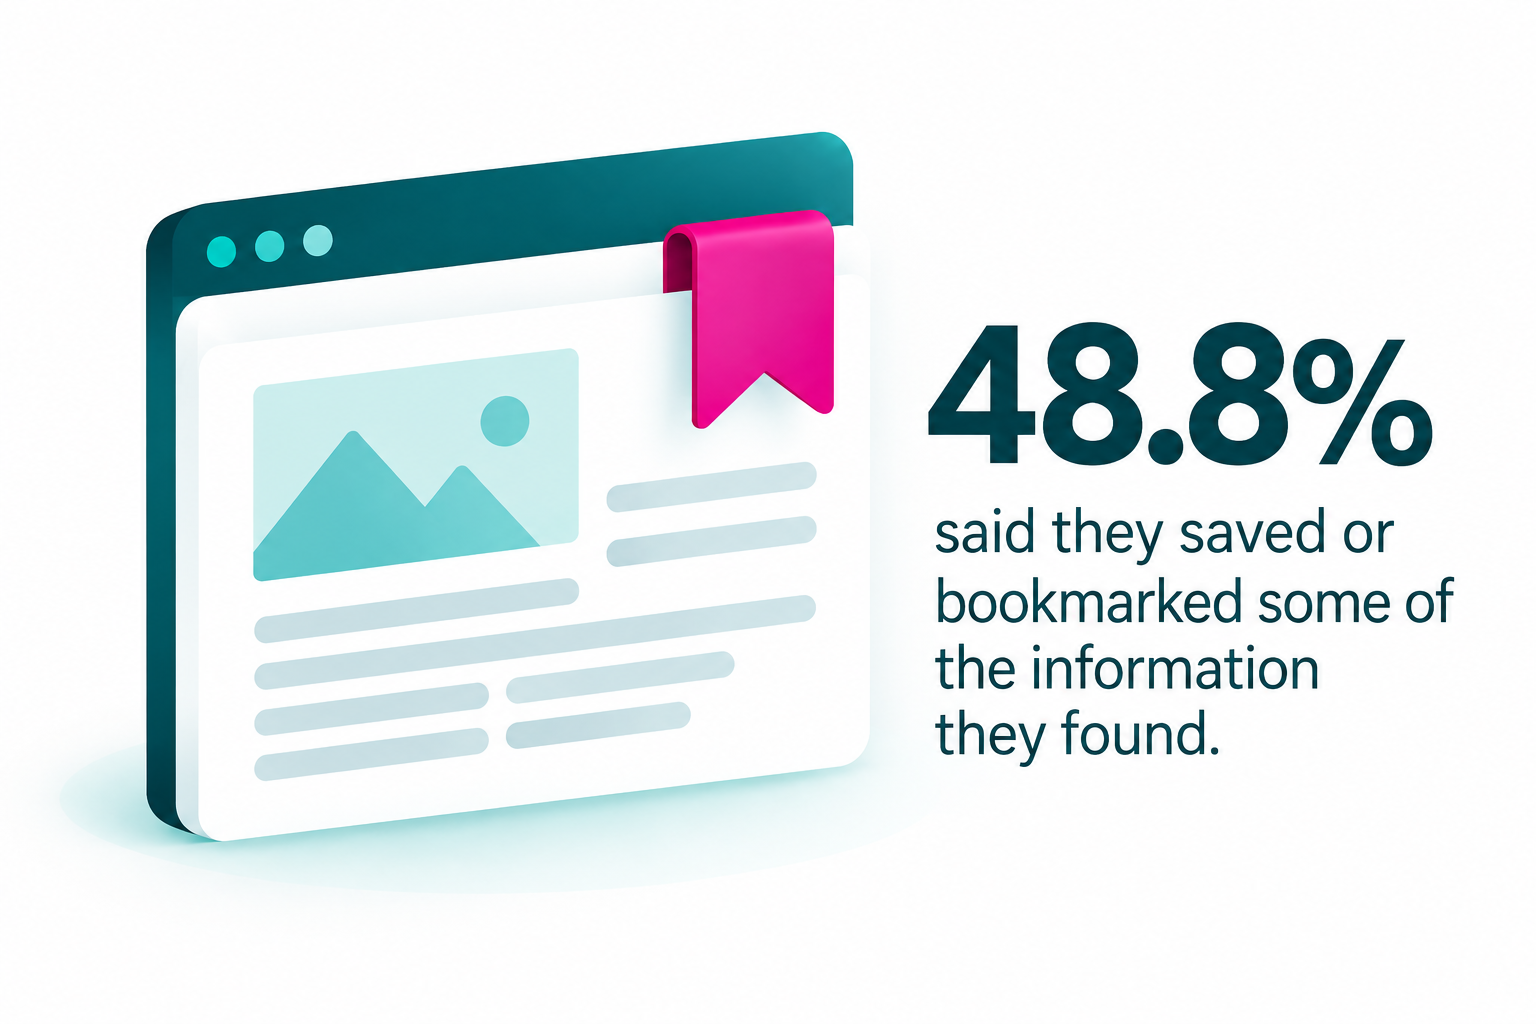
The raw sample was evenly divided between yes and no, with 70 respondents in each category and 10 saying they did not remember. The stratified result therefore places the share saving information slightly above the share that did not.
Three-Quarters Expected the Information to Retain Value One Month Later
The survey asked respondents how useful they expected the information they had found to be one month later.
34.9% expected it to be very useful, while 40.1% expected it to be somewhat useful. Combined, 75.1% expected the information to remain at least somewhat useful after one month.
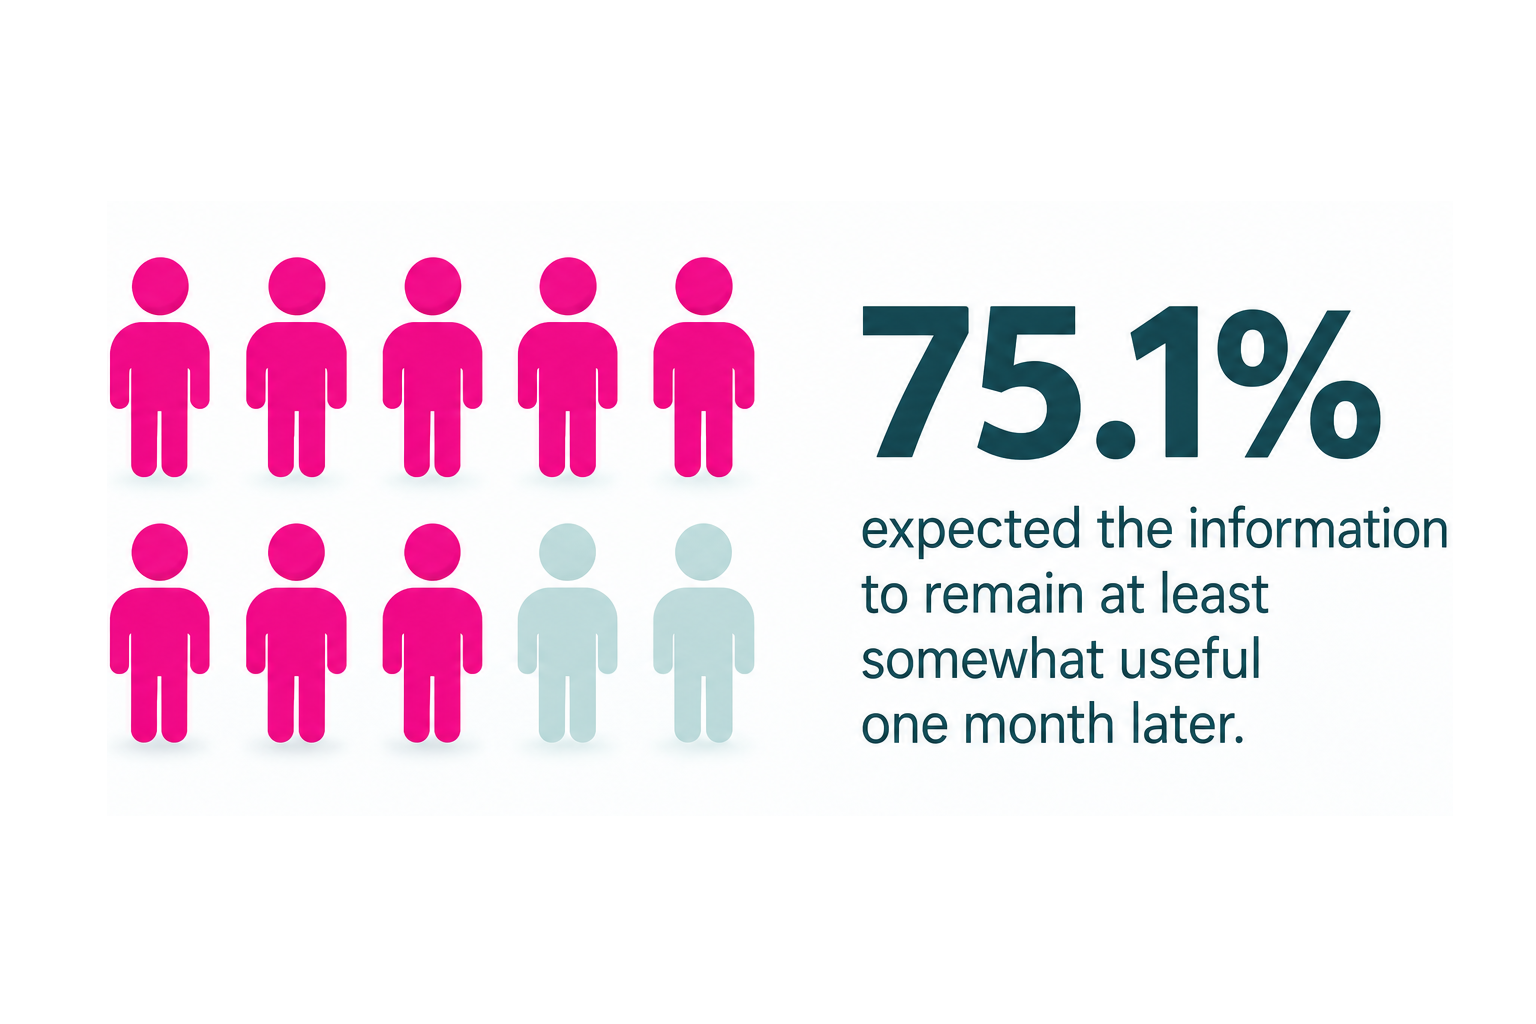
By comparison, 10.4% expected it to be not very useful, 4.1% expected it to be not at all useful, and 10.4% were not sure. The combined share expecting little or no future usefulness was 14.5%.
This question measures respondents' expectations rather than observed behaviour one month later. It should therefore be reported as anticipated future usefulness, not demonstrated long-term usefulness.
About Four in Ten Encountered Company Content Addressing the Question
Respondents were asked whether, while researching the development, they encountered content from a company that addressed their question. News publishers reporting the story were explicitly excluded.
On a stratified basis, 42.0% said yes, 35.7% said no, 12.3% were not sure, and 10.0% did not remember. The corresponding raw counts were 66 yes, 52 no, 18 not sure and 14 who did not remember.
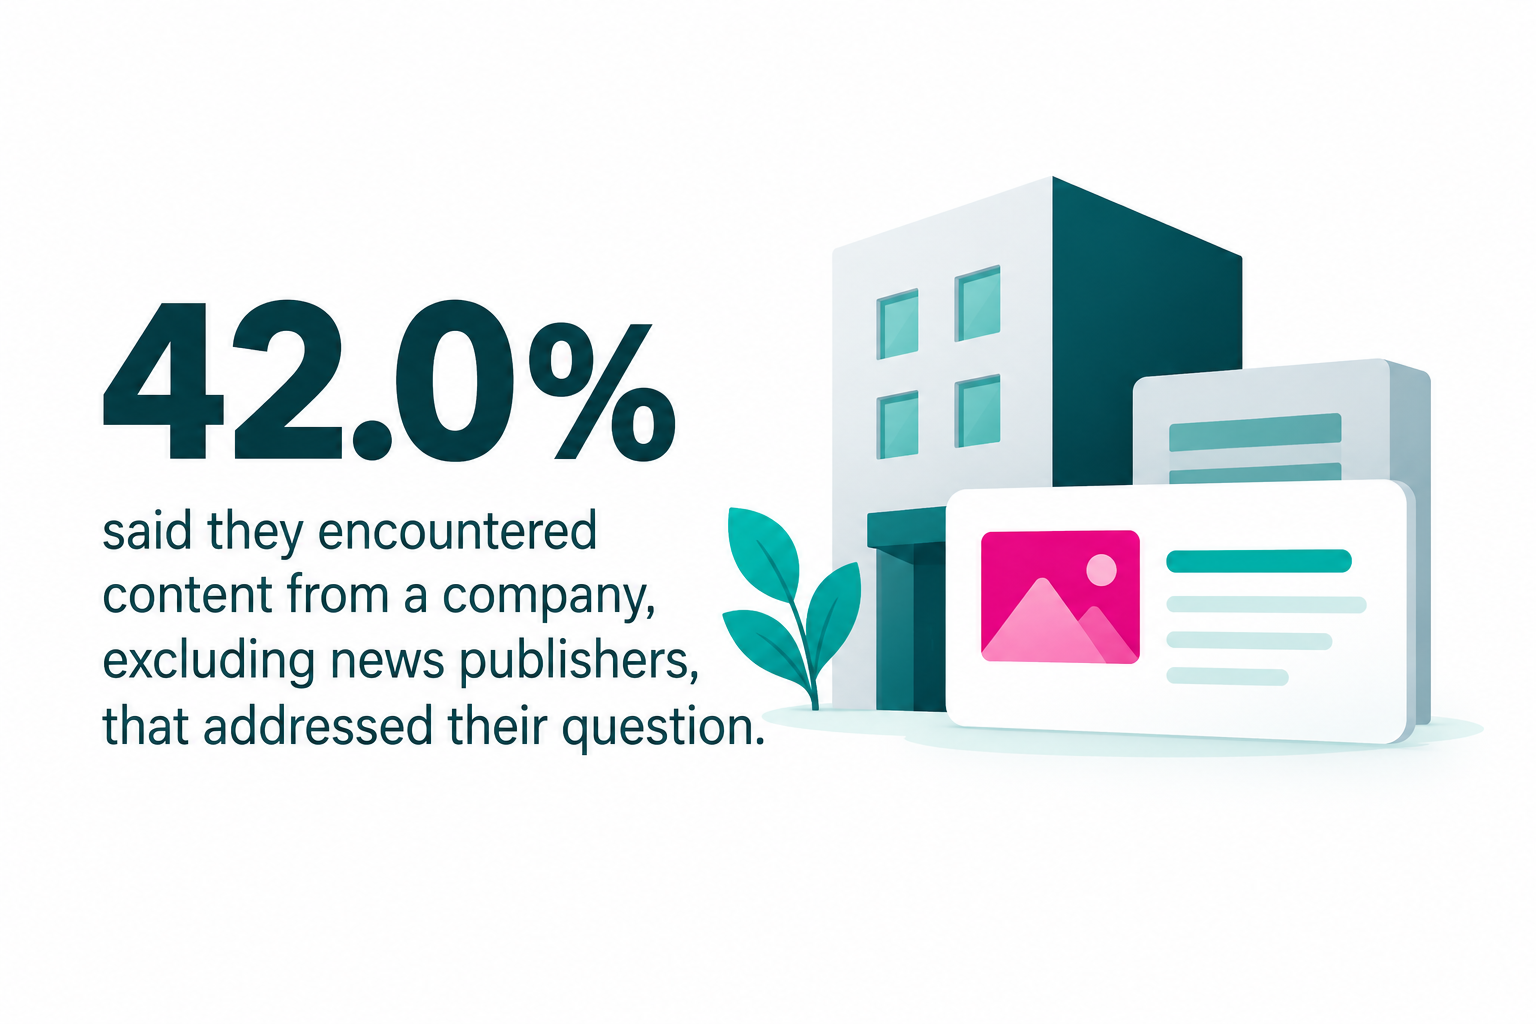
This establishes that 66 of the 150 respondents form an identifiable subgroup who explicitly reported encountering relevant company content.
Important Routing Issue Affecting Subsequent Company-Content Questions
The respondent-level data show that all 150 respondents answered the three subsequent questions about company content, not only the 66 respondents who had answered yes to encountering it.
This creates an inconsistency in the survey flow. Respondents who answered "No" to encountering company content were nevertheless subsequently asked what the most recent company content included, how helpful that company's contribution was, and what they had done since encountering it.
The aggregate figures for these questions provided in the workbook are therefore full-sample figures and combine respondents who explicitly said they had encountered company content with respondents who had said they had not.
For research reporting, the safer approach is to restrict substantive interpretation of these questions to the 66 respondents who answered yes to the encounter question. The original full-sample toplines are preserved in Appendix A for data fidelity.
Among Respondents Who Encountered Company Content, Explanations and Practical Information Were Common
Among the 66 respondents who explicitly said they encountered company content addressing their question, the respondent-level weights produce a weighted base of approximately 63.1.
Within this subgroup, respondents could select multiple types of content the company material included:
- 48.8% said it included an explanation of what the development meant
- 42.0% said it included practical guidance on what to do
- 38.8% said it included a product or service promotion
- 36.5% said it included background information about the topic
- 30.6% said it included a brief reaction or acknowledgment
- 29.1% said it included answers to specific questions
- 20.0% said it included a humorous or entertaining response
- 0.0% said they did not remember
- 0.0% selected something else
Within this analytically restricted group, explanatory content was the most frequently reported characteristic of the company material. Practical guidance was also reported by more than four in ten on a stratified basis. A product or service promotion was reported by 38.8%, showing that informational and promotional elements were not mutually exclusive within respondents' recollections.
Company Contributions Were Usually Described as Helpful by Respondents Who Actually Encountered Them
Restricting the helpfulness question to the same 66 respondents, 53.0% described the company contribution as very helpful and 43.7% described it as somewhat helpful. Combined, 96.8% of the stratified subgroup described the company contribution as at least somewhat helpful.
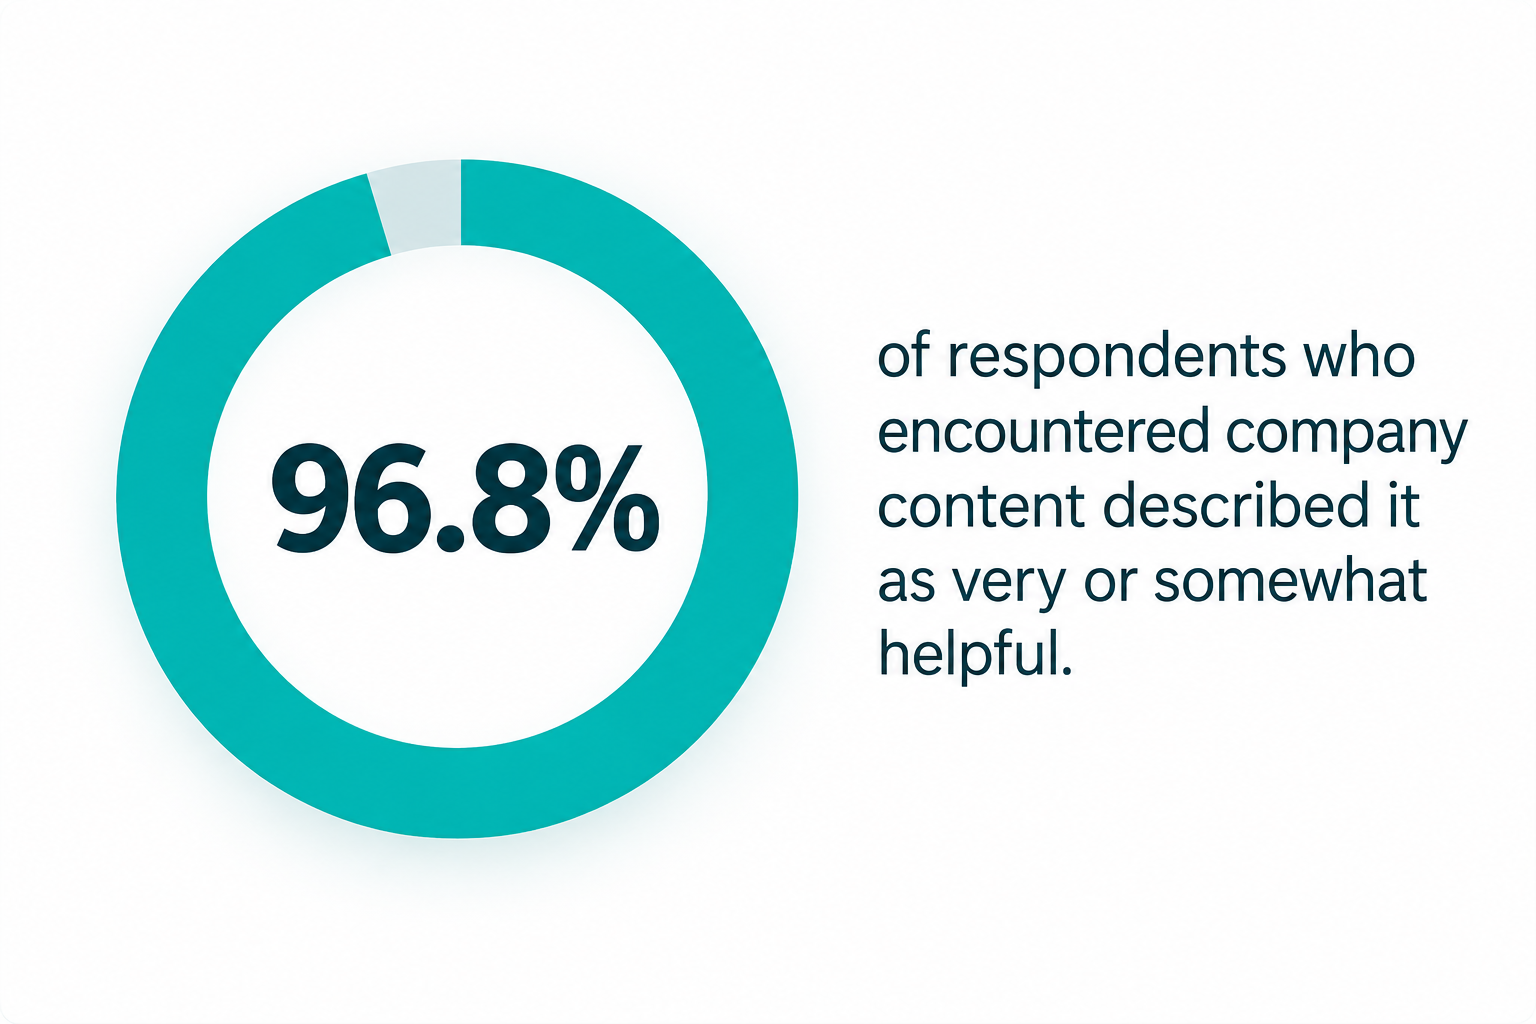
By comparison, 2.0% described it as not very helpful and 1.3% described it as not at all helpful.
The raw result was similar: 39 of the 66 respondents said very helpful and 25 said somewhat helpful, meaning 64 of 66 gave one of the two positive responses.
This is a finding about respondents who both encountered company content and identified it as addressing their question. It should not be generalized to all company content or to all respondents in the survey.
Company Content Was Sometimes Revisited, Saved, Shared or Used
Among the subgroup that explicitly encountered company content, respondents were asked what they had done since the encounter. Multiple responses were allowed.
On a stratified subgroup basis:
- 45.3% saved or bookmarked it
- 40.6% used it to help make a decision or complete a task
- 39.6% shared it with someone
- 34.7% returned to it for information
- 30.5% read other content from the same company about the topic
- 5.5% selected none of these
No respondents in this subgroup selected "I don't remember."
The raw counts were 34 who saved or bookmarked it, 28 who used it to make a decision or complete a task, 31 who shared it, 20 who returned to it for information, 24 who read other content from the company, and 4 who selected none of these.
These responses indicate that company content was not always treated as a one-time exposure by those who reported encountering it. The survey does not establish whether the content itself caused those subsequent behaviours.
Research Interpretation
Taken together, the survey results describe an information-seeking process that frequently continues beyond an initial event.
Respondents commonly wanted to understand not only what had happened but also how the subject affected them, what they should do, the background to the issue, and whether claims were accurate.
The subsequent behaviour measures are consistent with that broader information need. About seven in ten reported revisiting the underlying topic, nearly half saved information, and three-quarters expected the material they found to retain at least some usefulness one month later.
The content-format question also distinguishes between immediate information and deeper explanation. A detailed explanation was the single most commonly selected helpful format, although responses were distributed across multiple content types and the result does not indicate a majority preference for explanations.
The company-content results should be treated separately. The survey establishes that 42.0% of the stratified sample explicitly recalled finding company content that addressed their question. Among that group, explanatory information, practical guidance, background material and specific answers were all reported, alongside promotional content.
Those company contributions were generally described as helpful by the respondents who reported encountering them, and many said they subsequently saved, reused, shared or acted on the material.
The company findings are strongest when reported using the subgroup that explicitly encountered company content rather than the workbook's unfiltered full-sample toplines for the subsequent questions.
Limitations and Reporting Notes
Several limitations should be maintained in any interpretation based on these findings.
First, the survey is based on respondents recalling a recent information-search experience. Answers describe remembered behaviour and perceptions rather than directly observed browsing activity.
Second, the question about usefulness one month later measures expected usefulness, not whether respondents actually returned one month later.
Third, three questions allowed multiple responses. Percentages for individual choices therefore do not total 100%.
Fourth, the workbook contains stratification weights but does not include sufficient documentation about the sampling frame, recruitment process or statistical inference procedures to support claims of statistical significance or population representativeness from the spreadsheet alone.
Fifth, the three questions following the company-encounter question were not routed exclusively to respondents who answered yes to that question. Full-sample results for these questions are therefore preserved as part of the dataset but should not be presented as findings specifically among people who encountered relevant company content.
Finally, the subgroup that explicitly encountered company content contains 66 raw respondents. Percentage differences within that subgroup should therefore be reported descriptively and without implying precision beyond the available sample.
Methodology
The survey was conducted on September 21, 2026, using Pollfish. The sample consisted of 150 completed responses from the United States. Respondent ages ranged from 18 to 64.
Unweighted gender composition was 56.7% female and 43.3% male. After applying respondent-level weights contained in the workbook, the composition was approximately 50.8% female and 49.2% male.
Approximate weighted age-group composition was:
- 18-24: 17.3%
- 25-34: 21.9%
- 35-44: 20.1%
- 45-54: 20.2%
- 55-64: 20.5%
Individual respondent weights ranged from 0.52 to 3.32 and summed to approximately 150.03. Results are reported using stratified percentages based on these weights.
Respondents were asked to think about a recent occasion when something in the news, an announcement or a public discussion caught their attention and led them to look for more information. They then answered questions about what they wanted to understand, what content helped, whether they returned to the topic later, and whether they encountered company-produced content related to their questions.
The workbook does not provide documentation sufficient to establish population-level representativeness or statistical significance. Differences between individual percentages should not be interpreted as statistically significant unless separately tested.
Source for all findings and calculations.